
Data Frames in R Programming Language
Table of Content:
A data frame is a table or a two-dimensional array-like structure in which each column contains values of one variable and each row contains one set of values from each column.
Following are the characteristics of a data frame.
- The column names should be non-empty.
- The row names should be unique.
- The data stored in a data frame can be of numeric, factor or character type.
- Each column should contain same number of data items.
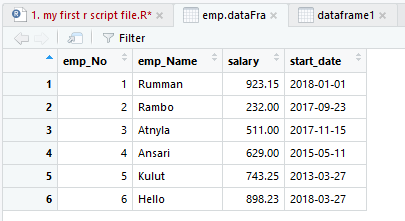
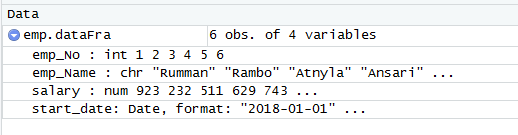
# Create the data frame.
emp.dataFra <- data.frame(
  emp_No = c (1:6),
  emp_Name = c("Rumman","Rambo","Atnyla","Ansari","Kulut","Hello"),
  salary = c(923.15,232.0,511.0,629.0,743.25,898.23),

  start_date = as.Date(c("2018-01-01", "2017-09-23", "2017-11-15", "2015-05-11",
                         "2013-03-27","2018-03-27")),
  stringsAsFactors = FALSE
)
# Print the data frame.
print(emp.data)
Expand Data Frame
A data frame can be expanded by adding columns and rows.
Add Column
Just add the column vector using a new column name.
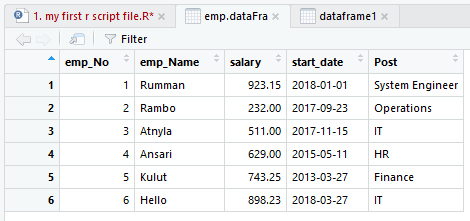
# Add the "Post" coulmn.
emp.dataFra$Post <- c("System Engineer","Operations","IT","HR","Finance","IT")
v <- emp.dataFra
print(v)
Output
> print(v)
  emp_No emp_Name salary start_date            Post
1      1   Rumman 923.15 2018-01-01 System Engineer
2      2    Rambo 232.00 2017-09-23      Operations
3      3   Atnyla 511.00 2017-11-15              IT
4      4   Ansari 629.00 2015-05-11              HR
5      5    Kulut 743.25 2013-03-27         Finance
6      6    Hello 898.23 2018-03-27              IT
Add Row
To add more rows permanently to an existing data frame, we need to bring in the new rows in the same structure as the existing data frame and use the rbind() function.
In the example below we create a data frame with new rows and merge it with the existing data frame to create the final data frame.
# Create the data frame.
emp.dataFra <- data.frame(
  emp_No = c (1:6),
  emp_Name = c("Rumman","Rambo","Atnyla","Ansari","Kulut","Hello"),
  salary = c(923.15,232.0,511.0,629.0,743.25,898.23),

  start_date = as.Date(c("2018-01-01", "2017-09-23", "2017-11-15", "2015-05-11",
                         "2013-03-27","2018-03-27")),
  stringsAsFactors = FALSE
)


# Create the second data frame
emp.newdata <- data.frame(
  emp_No = c (7:8),
  emp_Name = c("Jaman","Inza"),
  salary = c(722.5,632.8),
  start_date = as.Date(c("2013-07-30","2014-06-17")),
  stringsAsFactors = FALSE
)

# Bind the two data frames.
emp.finaldata <- rbind(emp.dataFra,emp.newdata)
print(emp.finaldata)
Output
> print(emp.finaldata)
  emp_No emp_Name salary start_date
1      1   Rumman 923.15 2018-01-01
2      2    Rambo 232.00 2017-09-23
3      3   Atnyla 511.00 2017-11-15
4      4   Ansari 629.00 2015-05-11
5      5    Kulut 743.25 2013-03-27
6      6    Hello 898.23 2018-03-27
7      7    Jaman 722.50 2013-07-30
8      8     Inza 632.80 2014-06-17